

The industrial sector in Dallas saw a considerable increase in investment volume during the first 10 months of this year, taking the lead nationally, CommercialEdge data shows. Going against the current, the metro registered a $1.1 billion growth compared to the same time frame in 2023, reaching an overall figure of $3.8 billion.
Additionally, the market has a strong development pipeline, with 16.5 million square feet under construction. Of that, 13.3 million square feet broke ground in the first 10 months of this year. Phoenix is the only metro to surpass Dallas, with 28.1 million square feet underway.
Despite strong sales and development figures, the metro faces some headwinds, too. With 48.5 million square feet of industrial space coming online during the same period, the Metroplex’s vacant space saw a worrisome increase: the vacancy rate almost doubled year-over-year, from 4.1 percent to 8.3 percent. That figure is also higher than the 7.2 percent national average.
Dallas sales reach new heights
Dallas’ industrial investment volume topped the national figures, taking the spotlight. The metro registered $3.8 billion in sales year-to-date as of October, marking a $1.1 billion increase compared to the same period in 2023. The market was followed by the Bay Area ($3.0 billion), Chicago ($2.6 billion) and Houston ($2.6 billion).

However, assets in the Metroplex traded for $113 per square foot on average, below the $129 national figure. The Bay Area ($465 per square foot) was the priciest market in the first 10 months of the year, while Houston ($108 per square foot) and Chicago ($100 per square foot) fared worse.
Earlier this fall, Stonepeak acquired two Fort Worth industrial assets totaling 1.1 million square feet from institutional investors advised by J.P. Morgan Asset Management. The two properties, Alliance Gateway 61 and Alliance Gateway 53, are rail-served.
Completions almost halve, still higher than national figures
Dallas’ industrial sector saw 27.4 million square feet coming online year-to-date as of October. The 99 delivered properties account for 2.8 percent of the market’s total stock, 120 basis points above the national average. However, completions in the metro almost halved year-over-year. In the first 10 months of 2023, roughly 48.5 million square feet came online across 137 properties—about 5.2 percent of the metro’s stock at the time.
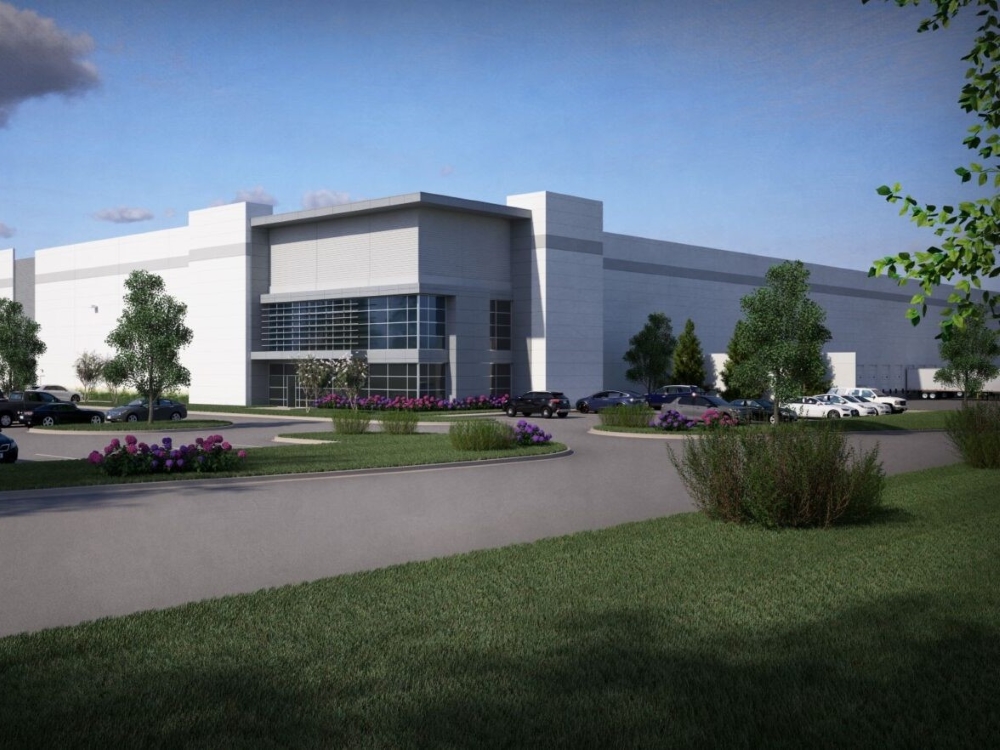
Compared to peer markets, only Phoenix (29.0 million square feet) surpassed the Metroplex. The Inland Empire (19.2 million square feet), New Jersey (7.9 million square feet) and Atlanta (7.1 million square feet) trailed behind.
In November, Transwestern Development Co. completed the five-building Mid-Cities Logistics spanning 908,300 square feet. The developer broke ground on the 65-acre project in February last year and took out a $64.5 million construction loan from Fifth Third Bank.
Second-largest development pipeline in the US
In terms of the development pipeline, Dallas’ industrial sector ranked second nationally, as well. The metro had 16.5 million square feet of industrial space under construction, representing 1.7 percent of its total inventory—slightly below the 1.8 percent national figure.
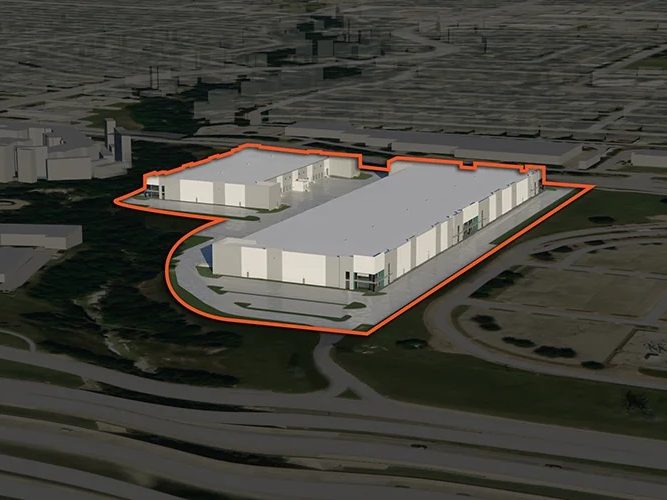
Phoenix (28.1 million square feet) remained in the first place, followed by Philadelphia (12.7 million square feet), Kansas City (11.7 million square feet) and Houston (11.6 million square feet). As of October, year-to-date starts in the Metroplex account for 13.3 million square feet, a considerable decrease after averaging about 42.6 million square feet between 2021 and 2023.
In October, Hillwood announced plans to break ground on Alliance Westport 24, a 1.1 million-square-foot industrial building in Fort Worth, Texas. The speculative facility rising within a 27,000-acre campus is slated to come online in the fourth quarter of next year.
Other notable activities in the area include Foundry Commercial’s office-to-industrial conversion project in Plano, Texas. The firm is replacing a 250,000-square-foot building completed in the 1980s with two industrial facilities totaling more than 300,000 square feet. Completion is scheduled in the first quarter of 2026.
Vacancy rate more than doubles as facilities come online
Dallas’ industrial vacancy rate as of October reached 8.3 percent, more than double the 4.1 percent registered during the same month in 2023. Additionally, the figure was 110 basis point above the 7.2 percent national index. Among other major industrial markets, Indianapolis (9.1 percent) posted a higher vacancy rate, while Atlanta (6.1 percent) and the Orange County (4.3 percent) had less available space.
During the same month, the Metroplex’s average rent clocked in at $6.17, registering an 8.1 percent growth compared to year-ago figures. Orange County ($15.95) was the priciest metro, followed by Los Angeles ($15.05), the Bay Area ($13.49) and Miami ($12.07).
Earlier this year, Google signed a 1.1 million-square-foot lease within Majestic Realty’s Creek Business Park in North Fort Worth, according to CommercialEdge. This extension is part of the company’s strategy to invest $1 billion in the state to support cloud and data infrastructure.