

Philadelphia’s office sector remained sluggish in the first five months of the year, according to Yardi Research Data. The metro’s investment volume year-to-date as of May reached $154 million, with assets trading for $100 per square foot on average. That price was almost half the national average.
The market’s development pipeline remained muted, with 1.2 million square feet underway—representing 0.7 percent of its total inventory. However, the metro occupied the 10th place nationally.
In terms of listing rates, Philadelphia’s figures witnessed a minor drop over the year. However, the vacancy rate rose almost 4 percent year-over-year.
Philly development pipeline outperforms some peers
Philadelphia’s office development pipeline clocked in at 1.2 million square feet as of May, accounting for 0.7 percent of the metro’s total inventory. Among peer markets, Dallas (3.2 million square feet) and Austin (2.7 million square feet) fared better, while the Bay Area (959,083 square feet) and Phoenix (623,905 square feet) were at the opposite pole.
When adding planned and prospective projects, Philadelphia’s pipeline reached 2.1 percent of stock, slightly below the 2.4 percent national figure. Austin (7.1 percent) led the U.S. rankings, followed by Boston (6.4 percent) and Miami (6.3 percent).
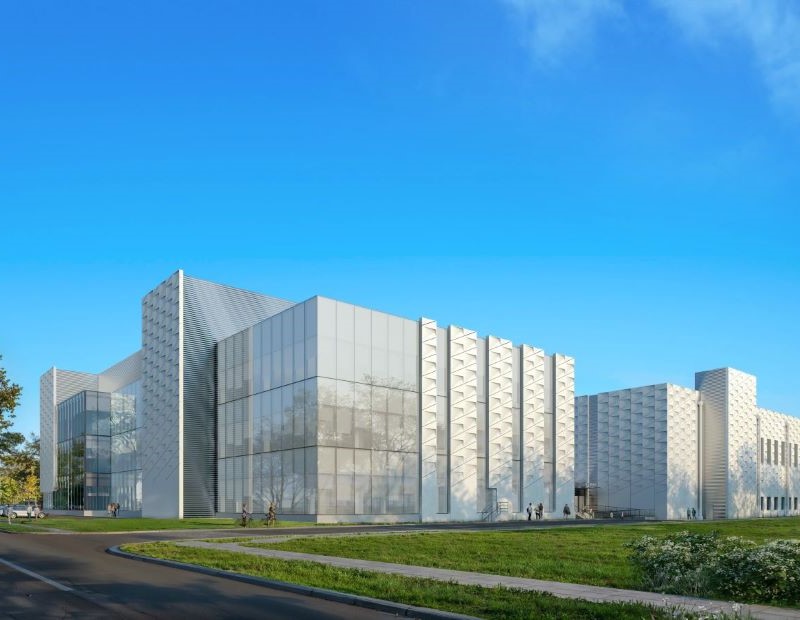
In April, Merck broke ground on a $1 billion, 470,000-square-foot biologics center with lab, manufacturing and warehouse spaces in Wilmington, Del. The laboratory component is expected to be fully operational by 2028.
In terms of office completions, only four properties totaling 476,443 square feet came online year-to-date as of May, representing 0.2 percent of Philadelphia’s inventory. The metro fared better than most peer markets and was second after San Diego, where deliveries totaled 856,484 square feet. San Francisco ranked first nationally for the most space completed (1.7 million square feet).
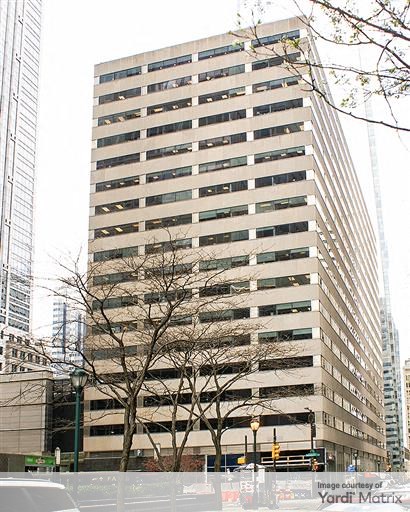
One of the developments that came online this year is Breakthrough Properties’ 2300 Market, a 225,000-square-foot building in Philadelphia’s Center City. The eight-story property is LEED Gold-certified.
Office-to-residential conversions at play
Due to the growing interest in office-to-residential conversions, Yardi developed the Conversion Feasibility Index, a tool designed to measure a building’s potential to be redeveloped into multifamily. The index’s values are split across three tiers, Tier I signaling buildings that are perfect candidates for conversion.
Metro Philadelphia had 116 office buildings in the Tier I category as of May. Another 289 properties, totaling more than 37.8 million square feet, were in Tier II.
At the beginning of May, the 18-story building at 1701 Market St. welcomed its first residents. The community is the result of the adaptive reuse of a 304,037-square-foot office property that had a CFI score of 95. The high-rise now comprises 299 rental units.
Sales activity below most large metros
Philadelphia’s office sales volume year-to-date as of May totaled $154 million. The metro lagged most major U.S. markets, except for Portland ($87 million), Detroit ($59 million), Nashville ($45 million) and the Inland Empire ($18 million).
Assets in the metro changed hands for $100 per square foot on average, almost half the $194 national average. Among similar markets, the Bay Area ($356 per square foot), Austin ($221 per square foot) and Dallas ($137 per square foot) had higher sale prices, while Denver ($96 per square foot) fared worse.
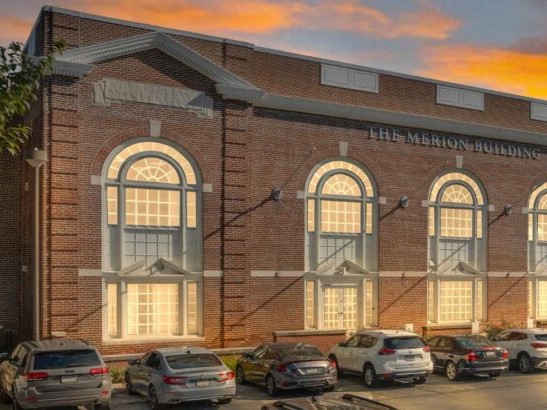
One of the properties that traded in the first five months of the year was The Merion Building, a 71,800-square-foot medical outpatient facility in King of Prussia, Penn. Onicx Group acquired the asset—that once served as a high school—from Peakstone Realty Trust.
Office vacancy rate continues to rise
Philadelphia’s office vacancy rate reached 19.2 percent at the end of May, 20 basis points below the national average but 3.8 percent higher year-over-year. Peer markets such as Dallas (23.5 percent) and Austin (26.7 percent) had more vacant space, while Charlotte, N.C. (17.6 percent) and Phoenix (17.4 percent) fared better.
The market’s average listing rate at the end of the same month was $31.2, down 20 basis points from the figure registered a year ago and slightly below the $33.2 national value. Among similar markets, the Bay Area ($52.9), San Diego ($45.2) and Austin ($46.1) performed better.
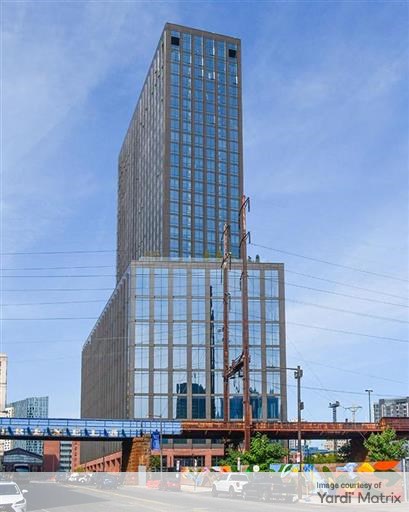
At the beginning of the year, FS Investment signed a 16-year lease for 117,000 square feet at 3025 JFK Blvd., Brandywine Realty Trust’s mixed-use tower. The company plans to relocate its global headquarters to the building starting next year.
Coworking sector remains steady
Philadelphia had almost 3 million square feet of coworking space across 159 locations, according to CommercialCafe. The figure accounted for 1.5 percent of the market’s total inventory, 50 basis points below the U.S. average. Manhattan (11.4 million square feet) ranked first nationally.
Compared to its peers, Philadelphia had one of the lowest shares of coworking space, having surpassed only the Bay Area (1.4 percent). Nashville led among similar markets (3.3 percent), followed by San Diego (2.4 percent) and Denver (2.2 percent).
Regus had the most shared space in Philadelphia, almost 530,000 square feet of space across 28 locations. Other companies with large footprints in the metro included WeWork (132,388 square feet) and HQ (132,149 square feet).